
This project got started because Steem Engine is missing a charting functionality.
SPORTS is the native token of the https://www.sportstalksocial.com tribe. You can check the details in the announcement post by @patrickulrich: Introducing SportsTalk.Social and SPORTS.
They also have video - powered by DTube: Announcing SportsTube - Earn SPORTS for Sharing Videos.
And advertisments: SportsTalkSocial.com Advertising. Revenues from advertisments are being used to burn tokens. Everybody who owns more than 500k SPORTS will not see any advertisement.
Be aware: its a place for sports. That comes with tribalism and arch enemies. But also fair play.
Check yourself before you wreck yourself
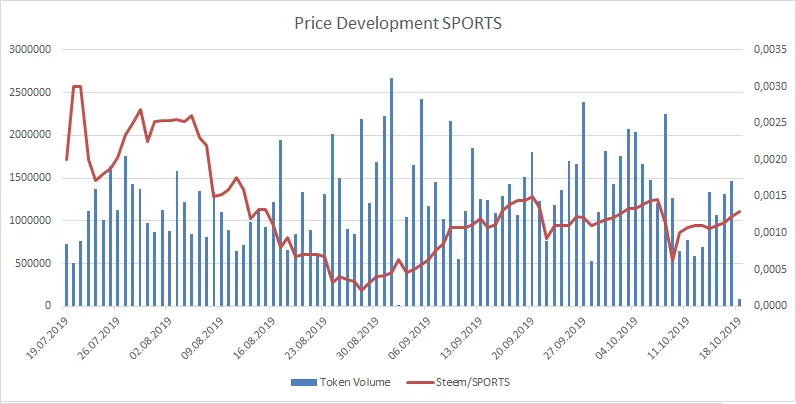
Left Y-Axis: Token Volume; Right Y-Axis: Steem/SPORTS
Time frame: 19.05.2019 until 21.10.2019
Data from 23.06. trough 18.07.19 omitted in chart because of extremely volatile price action during launch.
Price data is represented by daily lows in order to be conservative. Some tokens display a huge spread or sometimes don't trade at all. The daily low represents a bid where a transaction could happen.
Earlier posts in the series - ordered from newest to oldest:
SE Charts: WEED, WEEDM, WEEDMM
SE Charts: DEC - Dark Energy Crystals
If you want to make some charts on your own:
Charting Ressources for SE Tokens
Disclaimer 1: Author owns no SPORTS at the time of writing.
Disclaimer 2: These charts do not constitute investment advice. Because why in the world would you take investment advice from a random account on the internet? What is wrong with you? Don't do that!