
This project got started because I am missing a charting functionality within Steem Engine.
ONECENT is a strategic trading game from the Steem Fintech family of tokens around @mapac. It generates value by selling tokens in a starting auction, at fixed prices during the game, post rewards and by trading other SE tokens. For more details read the @onecent introductory post.
The game is currently on day 84 of 200. It can be entered and exited at any time - depending on the strategy.
Check yourself before you wreck yourself
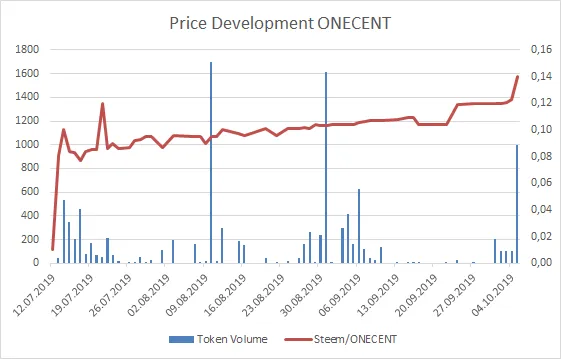
Left Y-Axis: Token Volume; Right Y-Axis: Steem/ONECENT
Time frame: 12.07.2019 until 05.10.2019
First day auction volume of 14345 tokens omitted in chart.
Price data is represented by daily lows in order to be conservative. Some tokens display a huge spread or sometimes don't trade at all. The daily low represents a bid where a transaction could happen.
Earlier posts in the series ordered from newest to oldest:
SE Charts: DEC - Dark Energy Crystals
Disclaimer 1: Author owns some ONECENT at the time of writing
Disclaimer 2: These charts do not constitute investment advice. Especially not for @trumpman.
Helpful links to navigate SE tokens:
Look up transactions and orders of a particular token:
https://steem-engine.rocks/transactions?symbol=ONECENT
Look up the distribution of tokens between accounts:
https://steem-engine.rocks/tokens/ONECENT/richlist?sort_field=balance&sort_order=desc
If you want to make charts on your own, go ahead and do it. It only takes a few, easy steps. Basic Excel skills is all you need. Mainly formatting data and plotting.
harpagon made two posts on how to pull .json data from the API.
These are the steps to create your own charts:
- This is the call to get data: https://api.steem-engine.com/history/marketHistory?symbol=ONECENT
- Convert the raw .json data into .csv: https://json-csv.com/
- Convert the time stamp from Unix Time into human time in Excel with this formula:
=(((B2/60)/60)/24)+DATUM(1970;1;1)B2 is a placeholder for the cell to be converted - Depending on your country settings you might have to convert the decimal format from '.' to ',' (from point to comma). It may be necessary to specify the format of date and numbers columns.
- Excel charting magic happens here
Requests
for SE tokens you want to see charted.
NEOXAG
LEO
UFM
PHOTO
SPACO
LIFESTYLE