
Complaining is easy. Doing something about it is harder.
One thing I like to to see is a charting option within Steem Engine.
As a third chart I decided to listen to popular demand: BEER
There can never be enough beer. Beer IRL, beer tokens and beer charts.
Not Investment Advice --> Kids, drink responsibly! <-- Not Investment Advice
The beer token was launched by @detlev as a fun project to celebrate beer.
For every 6 BEER staked you can distribute 0,1 BEER per day by replying to a post or comment.
Thanks to his continuous work of promoting, evolving and distributing, it turned into a successful tipping token by accident.
Demand for beer is so high that the @beerlover account is constantly low on RC.
If you like beer or tipping and have a few SP to spare, consider delegating to @beerlover.
The spice beer must flow.
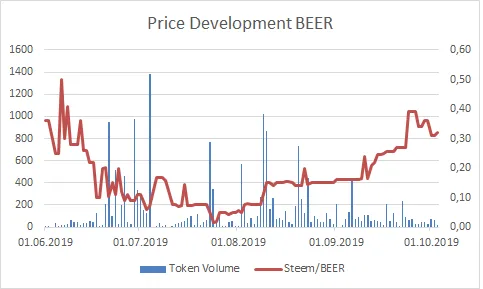
Left Y-Axis: Token Volume
Right Y-Axis: Steem/BEER
Horizontal Axis: Time
Time frame: 01.06.2019 until 03.10.2019
Price data is taken from daily lows.
Data is available as far back as 18.03.2019. Data before 01.06.2019 is omitted because there was hardly any trading in the beginning of the project. Prices are therefore not comparable to the current situation.
Earlier posts in the series - ordered from newest to oldest:
SE Charts: DEC - Dark Energy Crystals
Feel free to make suggestions about SE tokens you want to see charted.
If you want to make charts on your own, go ahead and do it. It only takes a few easy steps. Basic Excel skills is all you need. Mainly formatting data and charting.
@harpagon made two posts on how to get .json data from the API.
These are the steps:
- This is the call I used for the above data: https://api.steem-engine.com/history/marketHistory?symbol=BEER
- Convert the raw .json data into .csv: https://json-csv.com/
- Convert the time stamp from Unix Time into human time in Excel with this formula:
=(((B2/60)/60)/24)+DATUM(1970;1;1)B2 is a placeholder for the cell to be converted - Depending on your country settings you might have to convert the decimal format from '.' to ',' (from point to comma). It may be necessary to specify the format of date and numbers columns.
- Excel charting magic happens here
Santé! Cin cin! Proost! Cheers! Kippis! Kanpai! Kanpai!! Kanpai!!!