
Complaining is easy. Doing something about it is harder.
One thing I like to to see is a charting option within Steem Engine.
As a second chart I decided on is DEC - Dark Energy Crystals, the in-game currency token for Splinterlands:
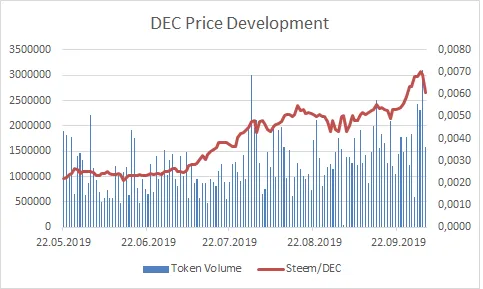
Left Y-Axis: Token Volume
Right Y-Axis: Steem/DEC
Horizontal Axis: Time
Time frame: 22.05.2019 until 02.10.2019
I cleaned the first days of trading out of my data set because they were unusual and don't add insight.
For pricing information I chose the daily low in order to be conservative. This is not important for a fairly liquid token like DEC but it will be a more realistic choice for more sparsely traded ones.
Past posts in the series - ordered from newest to oldest:
If you want to make charts on your own, go ahead and do it. It takes some steps but it is easy. A few basic Excel skills is all you need. Mainly formatting data and charting.
@harpagon made two posts on how to get .json data from the API.
These are the steps:
- This is the call I used for the above data:
https://api.steem-engine.com/history/marketHistory?symbol=DEC - Convert the raw .json data into .csv:
https://json-csv.com/ - Convert the time stamp from Unix Time into human time in Excel with this formula:
=(((B2/60)/60)/24)+DATUM(1970;1;1)
B2 stands for the cell to be converted - Depending on your country settings you might have to convert the decimal format from '.' to ',' (from point to comma)
- Excel charting magic happens here
Have fun charting!