
This project got started because Steem Engine is missing a charting functionality.
GG is the "Good Game Token". It is the native token of the @steem-ace tribe. Gaming content of any kind is welcome. You can find them at https://www.steemace.io.
Besides GG tokens there are also miners available - GGM. Every staked GGM has the chance to win 1 of 17 tickets per hour. There is a maximum of 20k miner tokens around.
Check out the White Paper
Unstaking cooldown: 28 days
Check yourself before you wreck yourself
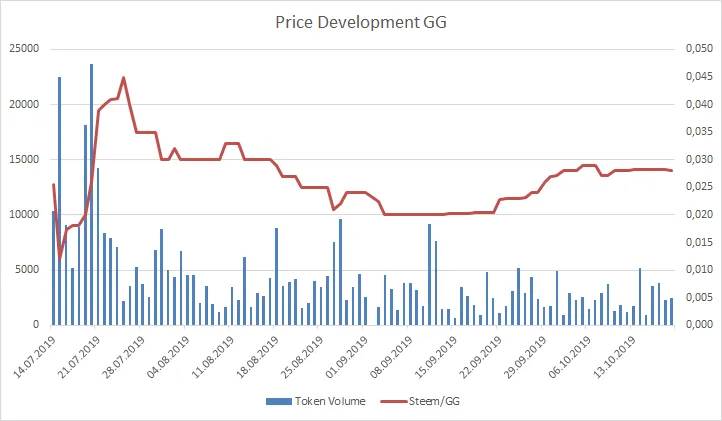
Left Y-Axis: Token Volume; Right Y-Axis: Steem/GG
Time frame: 14.07.2019 until 19.10.2019
Data from 12.07. through 13.07.2019 in chart omitted because of extreme volume during launch.
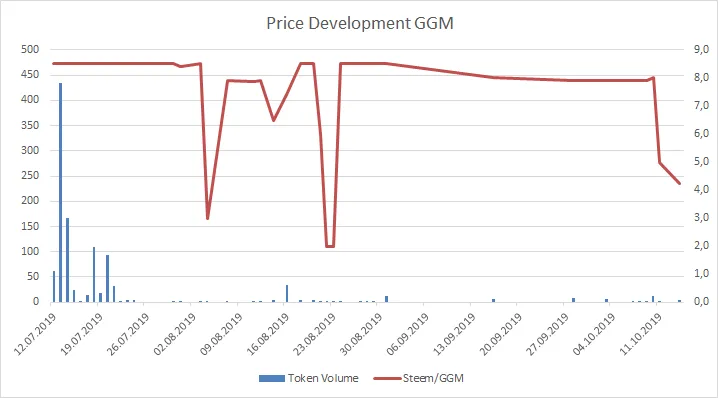
Left Y-Axis: Token Volume; Right Y-Axis: Steem/GGM
Time frame: 12.07.2019 until 19.10.2019
At the time of writing: 778 GGM staked. Source
Price data is represented by daily lows in order to be conservative. Some tokens display a huge spread or sometimes don't trade at all. The daily low represents a bid where a transaction could happen.
Earlier posts in the series - ordered from newest to oldest:
SE Charts: DEC - Dark Energy Crystals
If you want to make some charts on your own:
Charting Ressources for SE Tokens
Disclaimer 1: Author owns GG at the time of writing.
Disclaimer 2: These charts do not constitute investment advice. Because why in the world would you take investment advice from a random account on the internet? What is wrong with you? Don't do that!
GG, guys!