
This project got started because I am missing a charting functionality within Steem Engine.
A reader requested to chart NEOXAG aka Steem Silver. It is a token that aims to be scarcer than most others and works as the native token of the Neoxian tribe.
Check yourself before you wreck yourself
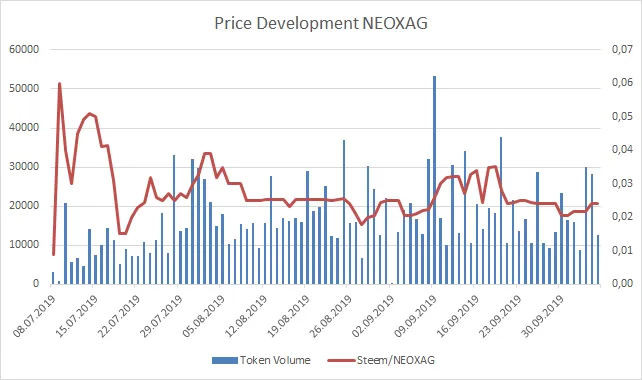
Left Y-Axis: Token Volume; Right Y-Axis: Steem/NEOXAG
Time frame: 08.07.2019 until 06.10.2019
Price data is represented by daily lows in order to be conservative. Some tokens display a huge spread or sometimes don't trade at all. The daily low represents a bid where a transaction could happen.
Just by looking at the chart it is apparent that NEOXAG looks very even with respect to volume and price when compared to other SE tokens. Let's see if numbers agree with our intuition:
| Token Volume | Steem/NEOXAG | |
|---|---|---|
| Median | 15525 | 0,025 |
| Average | 16850 | 0,028 |
| Max | 53232 | 0,06 |
| Min | 87 | 0,009 |
Indeed. Median and average are very similar when looking at volume and price. The extreme prices happened on the first (min) and second (max) day of trading.
Earlier posts in the series - ordered from newest to oldest:
SE Charts: DEC - Dark Energy Crystals
Requests for SE tokens you want to see charted.
LEO
UFM
PHOTO
SPACO
LIFESTYLE
Helpful links for charting SE tokens
Disclaimer 1: Author owns some NEOXAG at the time of writing
Disclaimer 2: These charts do not constitute investment advice. Especially not for @trumpman.