
This project got started because Steem Engine is missing a charting functionality.
The Trendo Token is a tipping service that allows Steemians to reward posts with tokens beyond upvotes. Similar to DRAMA or BEER. More details are in the TRDO token introductory post by @theguruasia.
That was the idea at least. Look at their last update. A different play on the curation window is only one of the smaller ideas.
Website: trendotoken.info
Check yourself before you wreck yourself
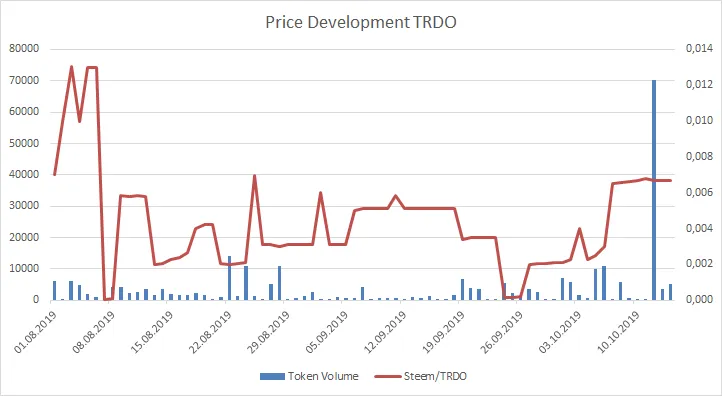
Left Y-Axis: Token Volume; Right Y-Axis: Steem/TRDO
Time frame: 01.08.2019 until 14.10.2019
Price data is represented by daily lows in order to be conservative. Some tokens display a huge spread or sometimes don't trade at all. The daily low represents a bid where a transaction could happen.
Data from 18.06 trough 31.07.2019 omitted in chart because of negligible trading volume until a healthy market developed.
Median trading volume per day is 1564 tokens and the mean is at 3610 tokens.
Earlier posts in the series - ordered from newest to oldest:
SE Charts: DEC - Dark Energy Crystals
If you want to make some charts on your own:
Charting Ressources for SE Tokens
Disclaimer 1: Author owns TRDO at the time of writing.
Disclaimer 2: These charts do not constitute investment advice. Especially not for @trumpman.