
This project got started because Steem Engine is missing a charting functionality.
MAPX is an asset-backed token out of the Steem FinTech family around @mapac.
There are two ways to play this token:
- 1 staked token delivers 0,1% upvote per day
- 1 unstaked token participates in the asset-backed price
Unstaking cooldown: 2 days
Other FinTech tokens already covered: ONECENT
Check yourself before you wreck yourself
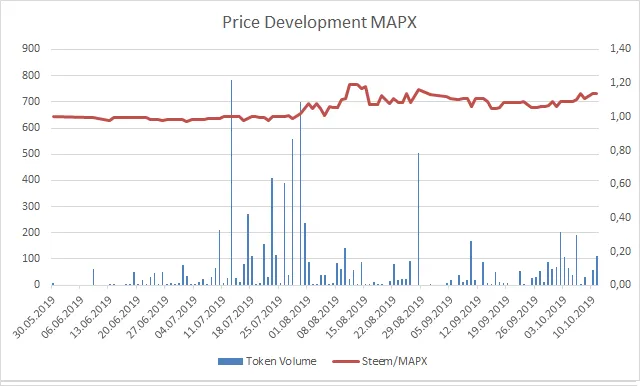
Left Y-Axis: Token Volume; Right Y-Axis: Steem/MAPX
Time frame: 30.05.2019 until 11.10.2019
Price data is represented by daily lows in order to be conservative. Some tokens display a huge spread or sometimes don't trade at all. The daily low represents a bid where a transaction could happen.
Earlier posts in the series - ordered from newest to oldest:
SE Charts: DEC - Dark Energy Crystals
If you want to make some charts on your own:
Charting Ressources for SE Tokens
Disclaimer 1: Author owns MAPX at the time of writing.
Disclaimer 2: These charts do not constitute investment advice. Especially not for @trumpman.