BEER token was launched by @detlev as a fun project to celebrate beer.
For every 6 BEER staked you can distribute 0,1 BEER per day by replying to a post or comment.
Thanks to his continuous work of promoting, evolving and distributing, it turned into a successful tipping token by accident.
You can join in on the fun at https://beersaturday.com
Follow @beerlover for regular updates about the state of BEER and weekly price Charts.
BOB Returns Calculation
In this edition I am going to use the BEER token to talk about the concept of Cash on Cash Return.
It strictly looks at cash coming in and cash going out. It does not take into account depreciation of the asset, price action or even compound interest.
It is not meant as a sole valuation tool but more of a sanity check.
Here is the back of the envelope BEER on BEER Return calculation:
- One 6-Pack allows to distribute 1 bit of BEER per day (0,1 BEER per day)
- 0,1 Beer p.d. = 36,5 BEER per year
- BoB = 36,5/6 is about 608% p.a.
Of course, this does not accrue to your own account, but it is the value of BEER you could distribute over a years time to other Steemians.
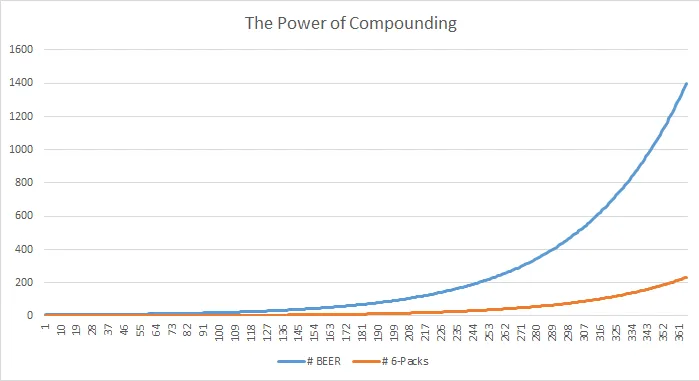
Let's have some fun and see what happens if we could give BEER to ourselves and compound/restake immediately. Only a full 6-Pack can distribute 0,1 BEER per day.
We start with one 6-Pack and give ourselves as much BEER per day as we can.

After one year of compounding BEER we end up with 233 6-Packs.
3883%! Such is the power of compounding.
Earlier coverage: SE Charts: BEER,
Unstake cooldown: 56 days - or 8 weeks. The time @detlev likes his beer to rest before enjoying it.
Check yourself before you wreck yourself

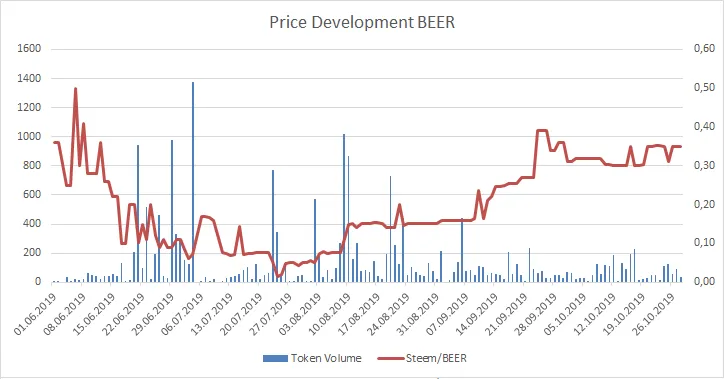
Left Y-Axis: Token Volume; Right Y-Axis: Steem/BEER
Time frame: 01.06.2019 until 03.10.2019
Data from 18.03. 2019 through 31.05.2019 is omitted because negligible trading volume.
Average trading volume is 134 tokens per day and median volume is 58.
Price data is represented by daily lows in order to be conservative. Some tokens display a huge spread or sometimes don't trade at all. The daily low represents a bid where a transaction could happen.
Earlier selected posts in the series - ordered from newest to oldest:
SE Charts: WEED, WEEDM, WEEDMM
If you want to make some charts on your own:
Charting Ressources for SE Tokens
Disclaimer 1: Author owns some BEER at the time of writing.
Disclaimer 2: These charts do not constitute investment advice.
Because why in the world would you take investment advice from a random
account on the internet? What is wrong with you? Don't do that!