
DEC, Dark Energy Crystals, the in-game currency token for Splinterlands:
Earlier coverage: SE Charts: DEC
Check yourself before you wreck yourself
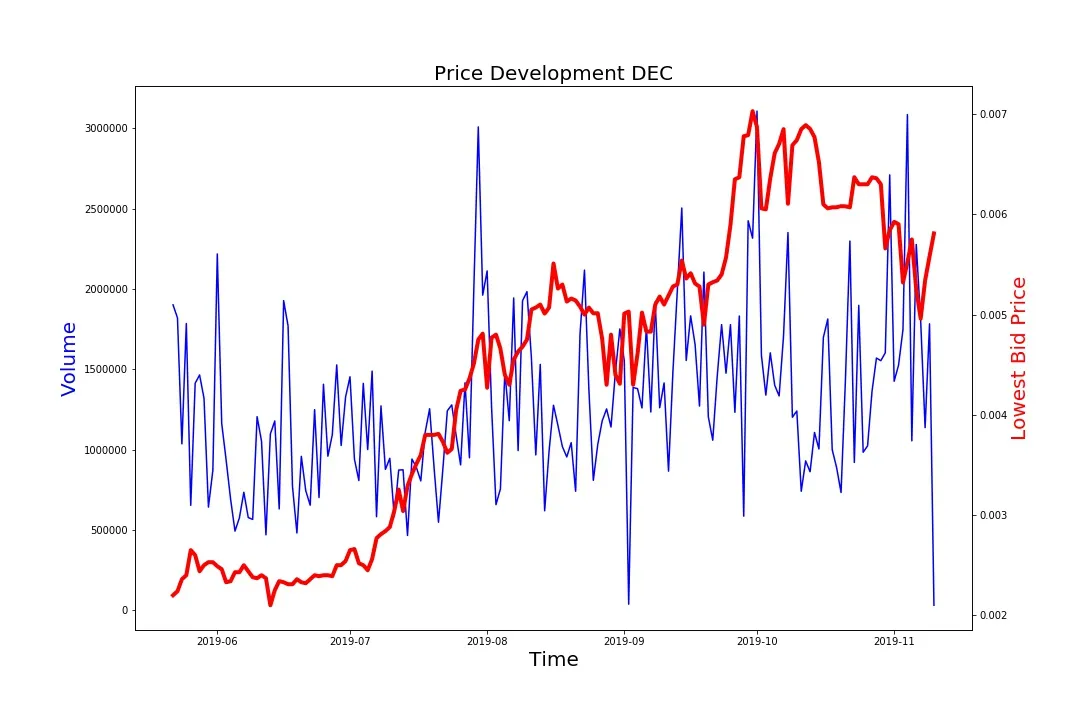
Left Y-Axis: Token Volume; Right Y-Axis: Steem/DEC
Time frame: 22.05.2019 - 10.11.2019
Data 20.05 through 21.05.2019 omitted in chart in order to clean out the launch period.
Token Volume
Lowest Bid
Mean
131'6290
0,0044
Median
124'8419
0,0048
Min
30'978
0,001
Max
444'6089
0,007
Price data is represented by daily lows in order to be conservative. Some tokens display a huge spread or sometimes don't trade at all. The daily low represents a bid where a transaction could happen.
Earlier selected posts in the series - ordered from newest to oldest:
SE Charts: BEER + Sober October
Complete list of charts per month in chronological order:
SE Charts in Chronological Order [Oct19]
If you want to make some charts on your own:
Charting Ressources for SE Tokens
Disclaimer 1: Author owns DEC at the time of writing.
Disclaimer 2: These charts do not constitute investment advice. Because why in the world would you take investment advice from a random account on the internet? What is wrong with you? Don't do that!