
RORS tokens are the game currency to the economic strategy simulation game http://roadofrich.com.
Check out the announcement post about the game itself. Also take a look at the post about token economy of the game.
Check yourself before you wreck yourself
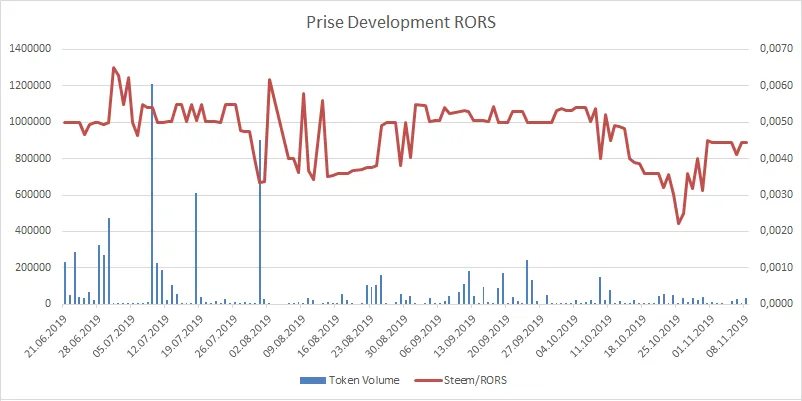
Left Y-Axis: Token Volume; Right Y-Axis: Steem/RORS
Time frame: 21.06.2019 until 08.11.2019
Data from 28.05. through 10.06.2019 omitted in chart.
Median trading volume is around 16000 tokens per day.
Price data is represented by daily lows in order to be conservative. Some tokens display a huge spread or sometimes don't trade at all. The daily low represents a bid where a transaction could happen.
Earlier selected posts in the series - ordered from newest to oldest:
SE Charts: BEER + Sober October
Complete list of charts per month in chronological order:
SE Charts in Chronological Order [Oct19]
If you want to make some charts on your own:
Charting Ressources for SE Tokens
Disclaimer 1: Author owns no RORS at the time of writing.
Disclaimer 2: These charts do not constitute investment advice. Because why in the world would you take investment advice from a random account on the internet? What is wrong with you? Don't do that!