
BEER token was launched by @detlev as a fun project to celebrate beer.
You can join in on the fun at https://beersaturday.com
Follow @beerlover for regular updates about the state of BEER and weekly price Charts.
Earlier coverage: BEER + BOB Returns, BEER,
Unstake cooldown: 56 days - or 8 weeks. The time @detlev likes his beer to rest before enjoying it.
Impact of Distribution on Price and Volume
BEER has two methods of distribution. I overheard at the bar that other means will be implemented soon.
The most beloved way is to give beer as reward for posts, the other the usual benefit of staking tokens.
You might have noticed that somebody has been too drunk to deliver beer to thirsty Steemians from 26.10. until 02.11.2019.
I was wondering what impact the reduced distribution of beer tokens would have on price and traded amount of tokens.
Method:
Compare two equally long time periods with different distribution methods:
- 18.10 - 25.10.2019 with distribution call working
- 26.10. - 02.11.2019 without distribution call working
Because of a limited data set (8 days each) and volatile behavior, we will be looking at median values.
What happened during the limited distribution period?
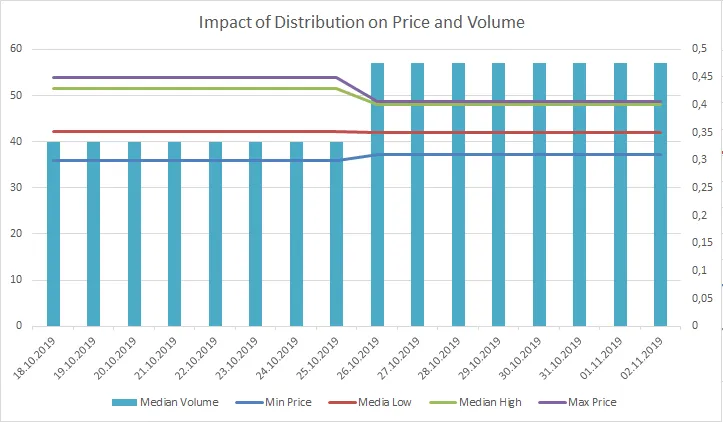
Spread contracted by 56%, mainly because daily highs came down while daily lows remained stable. Volume increased by 43%.
| Distribution | Limited Distribution | |
|---|---|---|
| Median Spread | 0,095 | 0,053 |
| Median Volume | 40 | 57 |
I went into this experiment with the expectation of lower trading volumes and lower daily lows.
Can we generalize from this? Probably not.
Did I learn something? Probably?
Was it a great idea? I don't know but I'm running with it. Fight me if you wish ;)
Will have to revisit this one with a little more perspective on how the data fits into the broader BEER trading environment.
Here is a look at token volume and moving averages of the volume over 10, 20 and 50 days.
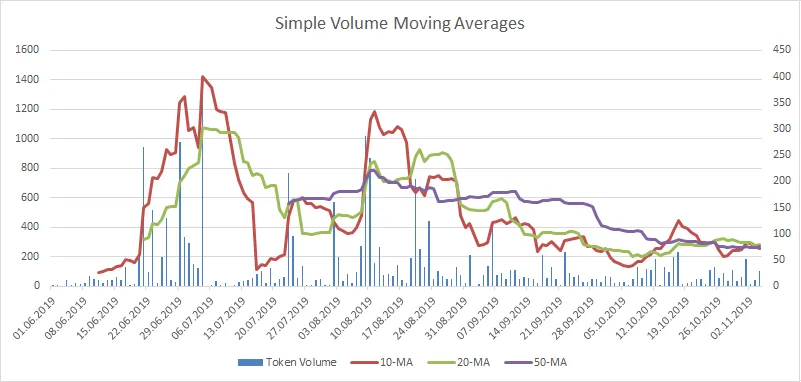
Check yourself before you wreck yourself
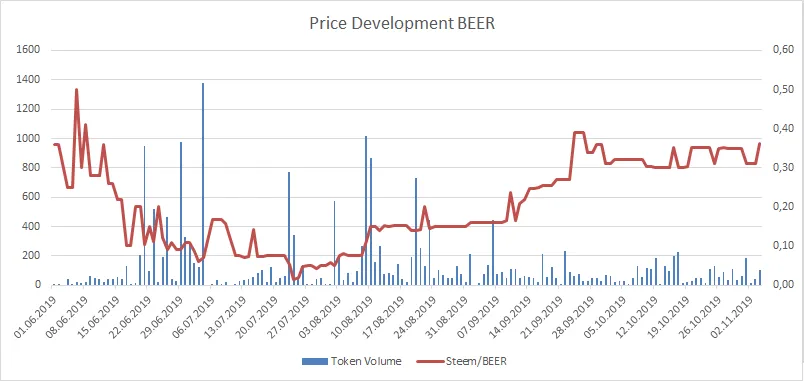
Left Y-Axis: Token Volume; Right Y-Axis: Steem/BEER
Time frame: 01.06.2019 until 04.11.2019
Data from 18.03. 2019 through 31.05.2019 is omitted because negligible trading volume.
Average trading volume is 132 tokens per day and median volume is 58.
Price data is represented by daily lows in order to be conservative. Some tokens display a huge spread or sometimes don't trade at all. The daily low represents a bid where a transaction could happen.
Earlier selected posts in the series - ordered from newest to oldest:
Complete list of charts per month in chronological order:
SE Charts in Chronological Order [Oct19]
If you want to make some charts on your own:
Charting Ressources for SE Tokens
Disclaimer 1: Author owns BEER at the time of writing.
Disclaimer 2: These charts do not constitute investment advice. Because why in the world would you take investment advice from a random account on the internet? What is wrong with you? Don't do that!