
STEM is the native token of the STEMgeeks tribe at https://stemgeeks.net.
Posts for this tribe have to revolve around the topics of sicence, technology, engineering and math. More colloquially speaking: this is a place for nerds.
Check out the announcement post to find out what kind of content is suitable for this tribe.
There are also mining tokens available. During the first year there will be 19,2 STEM distributed among 20 staked miners per hour.
Unstaking cooldown: 30 days - for STEM and STEMM
Check yourself before you wreck yourself
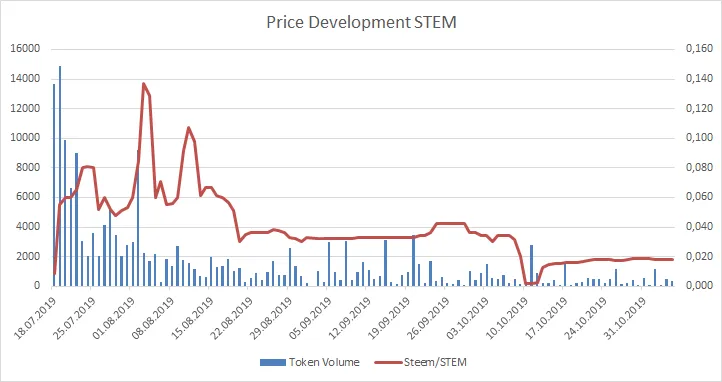
Left Y-Axis: Token Volume; Right Y-Axis: Steem/STEM
Time frame: 18.07.2019 until 05.11.2019
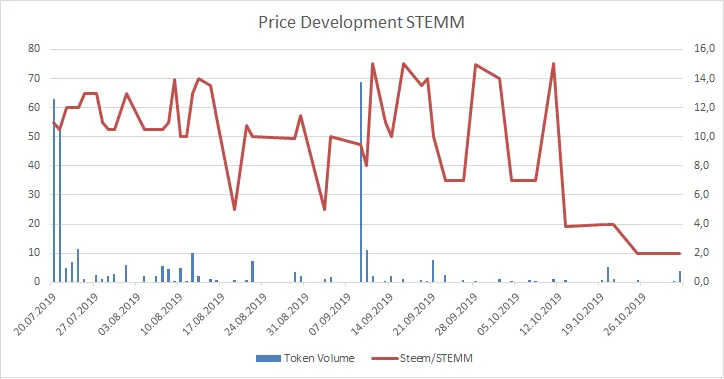
Left Y-Axis: Token Volume; Right Y-Axis: Steem/STEMM
Time frame: 20.07.2019 until 05.11.2019
First two days of trading for STEMM omitted in chart because of a massive volume spike which is not representative of normal trading.
Price data is represented by daily lows in order to be conservative. Some tokens display a huge spread or sometimes don't trade at all. The daily low represents a bid where a transaction could happen.
Earlier selected posts in the series - ordered from newest to oldest:
SE Charts: BEER + Sober October
Complete list of charts per month in chronological order:
SE Charts in Chronological Order [Oct19]
If you want to make some charts on your own:
Charting Ressources for SE Tokens
Disclaimer 1: Author owns STEM at the time of writing.
Disclaimer 2: These charts do not constitute investment advice. Because why in the world would you take investment advice from a random account on the internet? What is wrong with you? Don't do that!