The past several years, Nike has been plagued with inventory mismanagement issues. As an example, from 2016 to 2018 inventory levels as a percentage of sales increased from 57% to almost 60%. However, Nike recognized and tackled the issue head on. Nike sped up their pipeline to take advantage of new trends, increased their direct to consumer and e-commerce business and eliminated 25% fewer styles to focus on the best sellers. As a result, Nike was able to grow their top line, manage their inventory better and improve their margins and cash flow.
Did you know, Nike’s apparel sales growth topped footwear last quarter thanks in large part to their athleisure wear.
Lululemon is credited with introducing athleisure wear to the world 10 year ago. Today, athleisure isn’t only about clothing, athleisure has turned into a lifestyle. More and more people are prioritizing their health by way of what they eat, how they move and now what they wear.
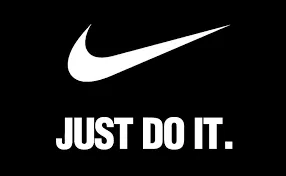
In 2016, the athleisure market was valued at $83 billion, but Morgan Stanley thinks the sector can grow to $350 billion, with 30% growth coming from Asia.
Since 60% of Nike’s sales is internationally and they have 8% market share in China (its closest competition, Adidas has 5% market share), Nike is in a great position to take advantage of the continued growing athleisure trend.
Piper Jaffray's Murphy recently upgraded the company.
We believe the risk profile of owning NKE shares has considerably diminished as negative EPS revisions are likely over," she said in a research note. "More importantly, we see the leaner-inventory backdrop, innovation-led product pipeline, (direct-to-consumer) shift & China expansion opportunities as firm drivers of an upward EPS cycle.
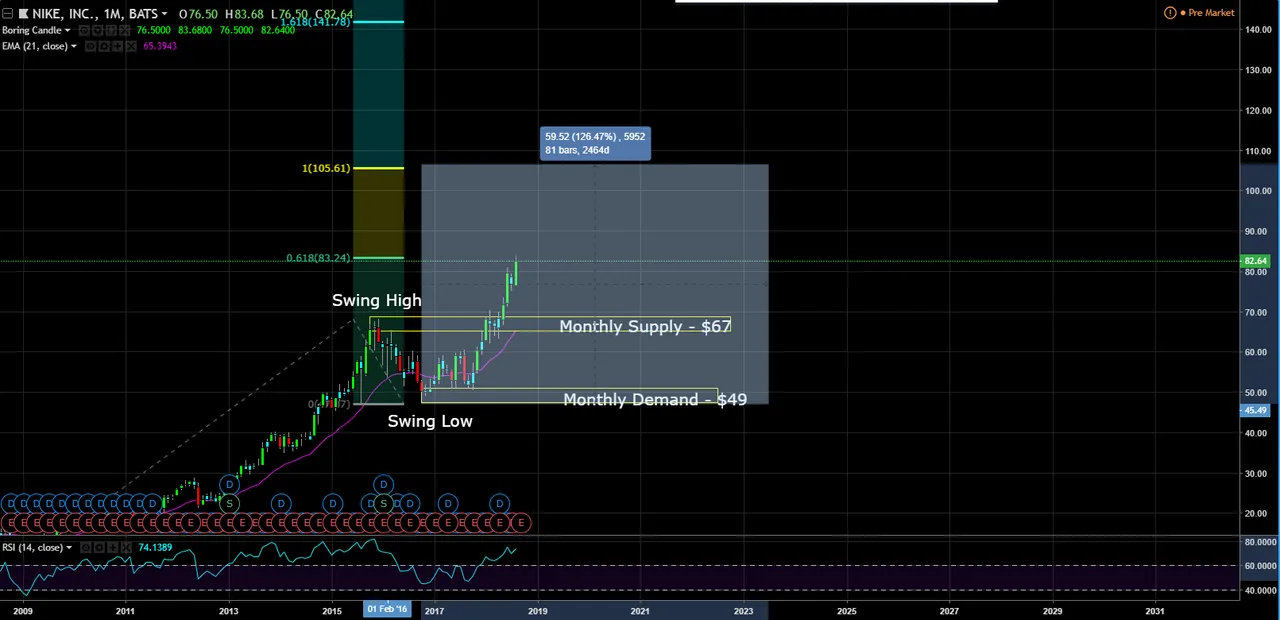
So how high can Nike’s stock price go, lets go to the charts. In May, price broke through the monthly supply at $67 to make all-time new highs. Thus, there is no supply above.
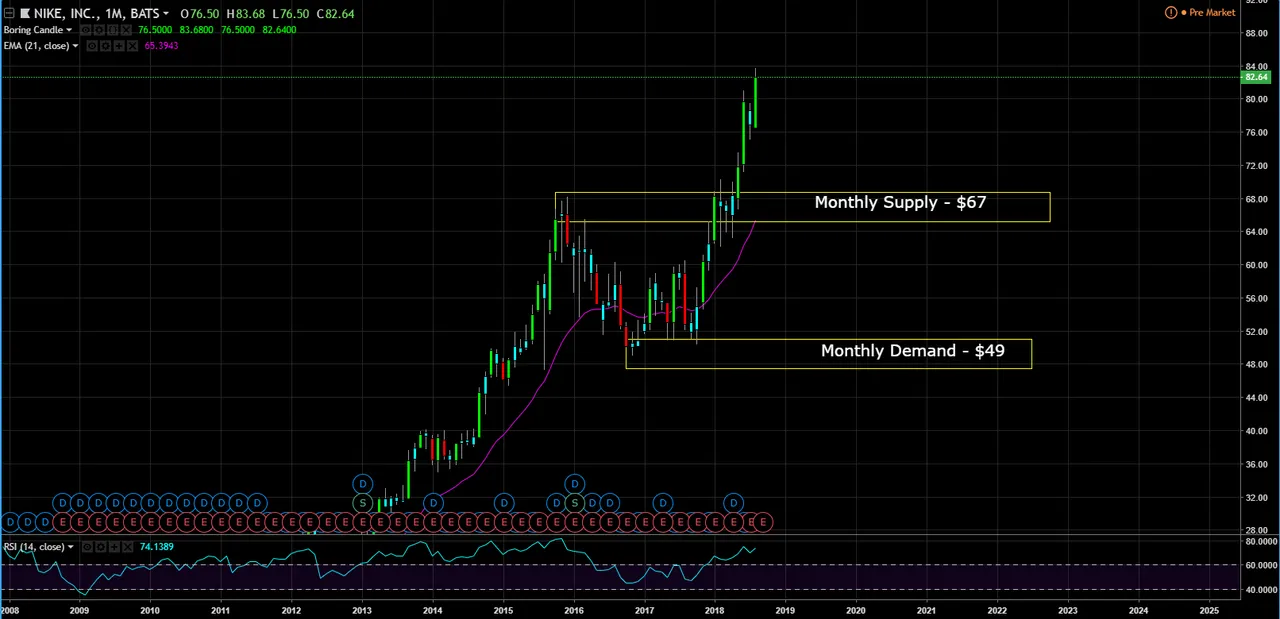
Usually when there is no more supply or demand, I apply fibonacci extensions. Fib extensions are used to forecast potential areas of resistance and support.
Commonly use fib extension levels are: 61.8%, 100%, 138.2%, 161.8%, 200%, 238.2%, 261.8%. When applying the fib extensions on the monthly chart, the fib 61.8% extension equates to the $84.24 level and the 100% fib extension equates to is $105.61 level.
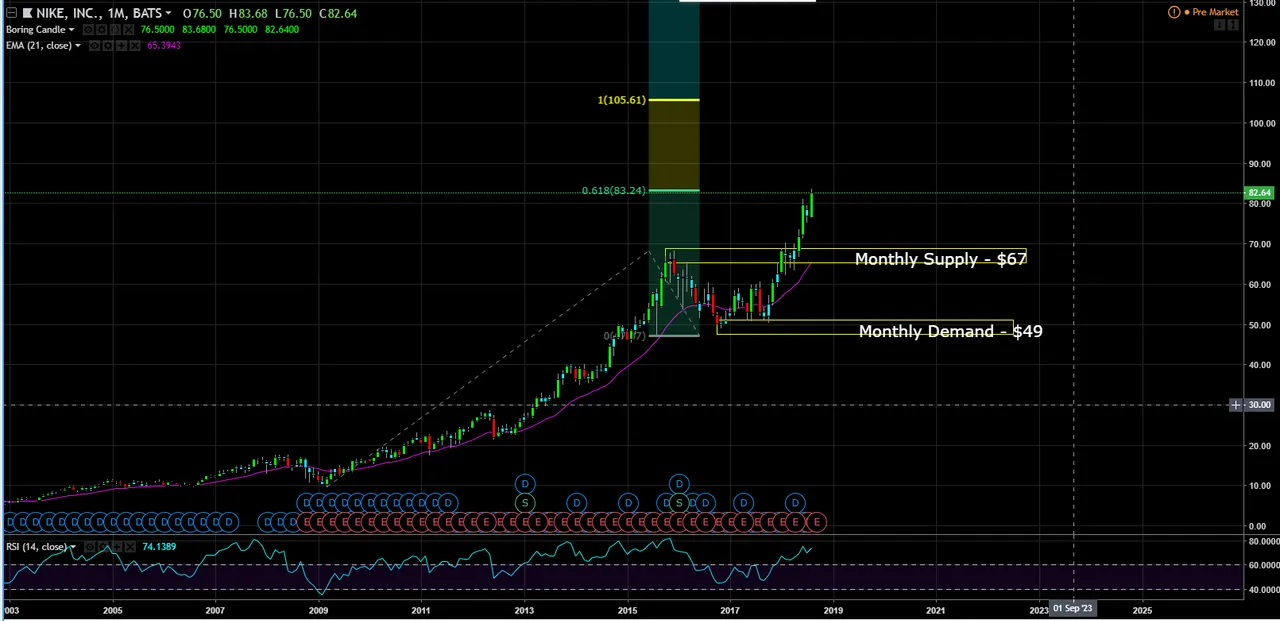
However, when there is no supply or demand, I often use measured moves as well. Measured move patterns state that the market has the tendency to move in similar price structure to how it moved in the past. On the monthly chart, the last swing low to the swing high was about a $60 move and took almost 7 years.
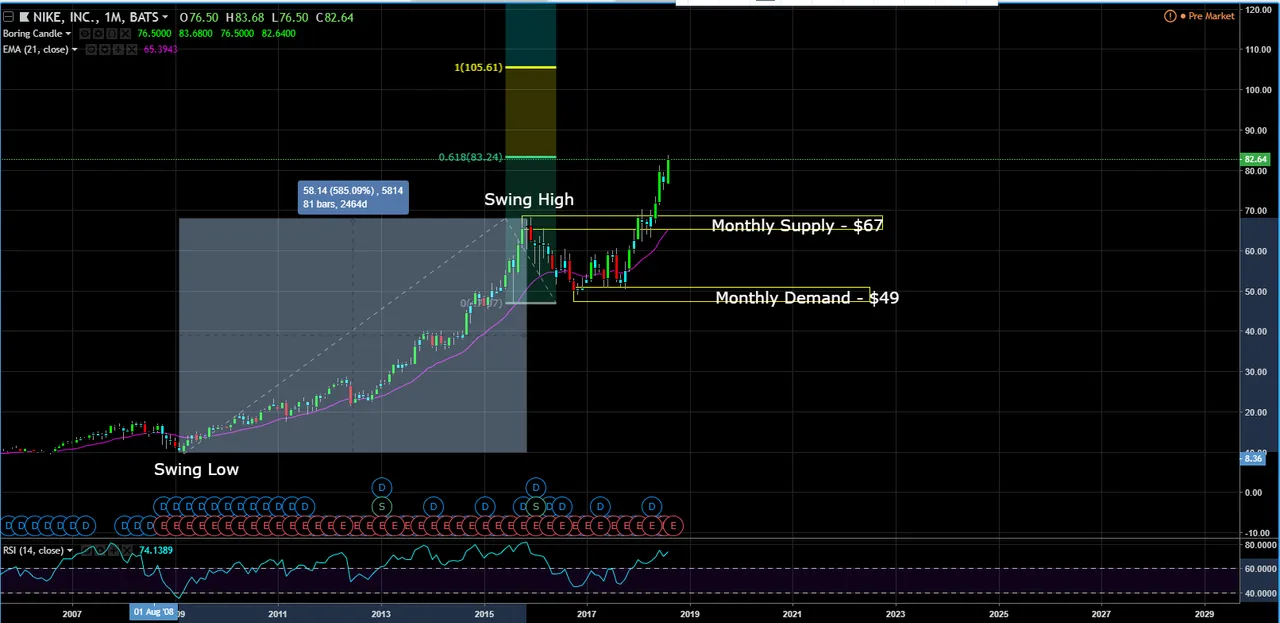
When applying this measured move forward, the anticipated target is approx. $106, which lines up with the 100% fib extension. Confluence occurs when several technical indicators give the same trade signal/target which lead to greater accuracy. In this cause the measured move and 100% fib extension suggest Nike can get to $105 in the coming years.
This post is my personal opinion. I’m not a financial advisor, this isn't financial advise. Do your own research before making investment decisions.

Published on

by rollandthomas